Sales Forecasting Dashboard
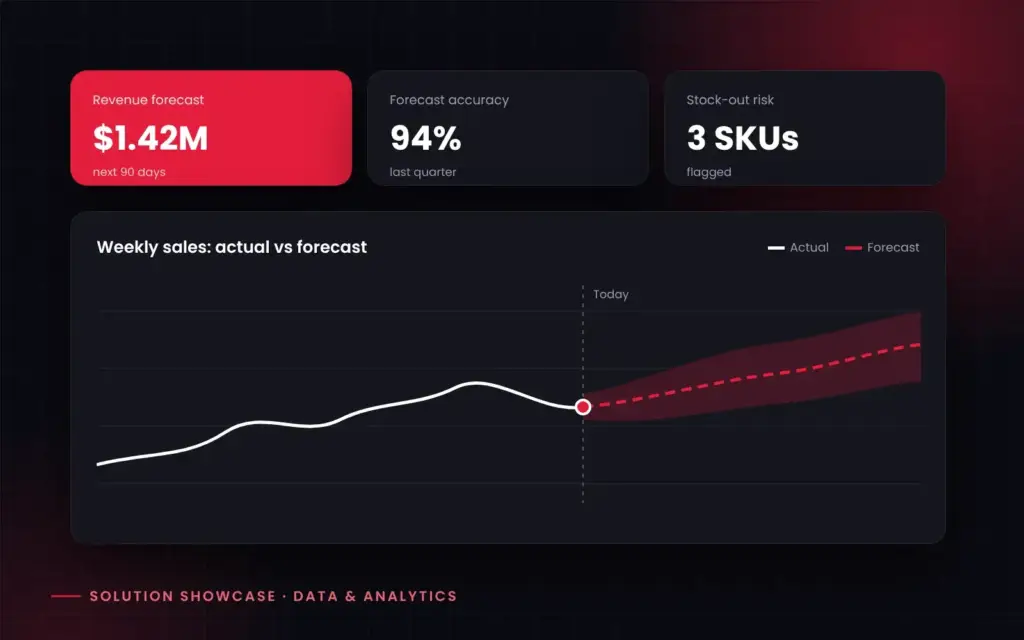
Solution showcase: a reference build that shows how we design and deliver this type of system. Every project is tailored to the client’s tools, data and processes.
A predictive analytics dashboard that combines sales, marketing and inventory data to forecast revenue and demand, and flags risks before they become problems.
The challenge
Many teams plan from spreadsheets and gut feel. Forecasts are built manually each month, go out of date quickly and cannot explain why numbers are moving.
What the solution does
- Brings sales, inventory and marketing data into one clean data model
- Forecasts revenue and demand by product, region and channel
- Shows confidence ranges, not just a single number
- Flags stock-out and overstock risk early
- Explains the main drivers behind each forecast
- Sends weekly summaries and alerts by email or Slack
How it works
- Data pipelines pull from the store, CRM, ERP and ad platforms on a schedule.
- Data is cleaned and modelled in a warehouse.
- Machine learning models produce forecasts with uncertainty ranges.
- Results feed an interactive dashboard and automated alerts.
- Model accuracy is monitored and models are retrained as new data arrives.
Tech stack
- Python
- scikit-learn / Prophet
- PostgreSQL or BigQuery
- FastAPI
- React dashboard
- Scheduled ETL pipelines
Who it is for
Ecommerce brands, retailers, distributors and finance teams that need reliable forecasts for planning, purchasing and budgeting.
Related services
Predictive Analytics · Python Development · AI Process Automation
Want a similar solution?
Tell us about your project and get a free consultation.
Talk To Us ← Back to portfolio